Ebus heating interface
Having just had a new boiler installed which uses Ebus to communicate round the house, I was interested to be able to read the Ebus messages and check the status of the various parts of the heating system.
So time to press into service a Raspberry Pi using the Ebusd software by John30
Set pi to static IP:
sudo nano /etc/dhcpcd.conf.
Uncomment the static IP section at the bottom (interface eth0 static ip_address=192.168.1.XX/24 etc)
A little bit of electronics is needed to interface to the ebus. I made the ebus interface from here:
https://ebus.github.io/adapter/index.en.html
Install ebusd see here
https://github.com/john30/ebusd/wiki/1.-Build-and-install
Configure ebusd to run on boot
https://github.com/john30/ebusd/wiki/2.-Run
make folder /var/ebusd/html (sudo)
Copy static html into ebus html folder just created
sudo cp -a /home/pi/ebusd/contrib/html/. .
Enable rpi uart to be used for ebus (special driver - normally it has a 2 char FIFO)
https://github.com/eBUS/ttyebus
sudo nano /etc/default/ebusd
set options - enable auto scan, set device to internal uart, allow for latency, enable http interface
EBUSD_OPTS="--scanconfig -device=/dev/ttyebus --latency=20000 --httpport=8080 --mqtt port=1883 --mqttjson"
To see what ebusd is doing
ebusctl state
ebusctl info
ebusctl find
(shows list of all possible parameters found on the ebus)
ebusctl read [name]
shows value for parameter name, as found in the "find" list above
To run ebusd on command line, stop service first
sudo service ebusd stop
then test uart link for stuff being received:
ebusd -f -c /tmp --logareas bus --loglevel info --lograwdata=bytes -d /dev/ttyebus
or trigger full scan:
ebusd --scanconfig=full -d /dev/ttyebus
To see http
http://
To see latest data
http://[ipaddr]
To see ebus logfile
nano /var/log/ebusd.log
install mosquitto broker for mqtt connections (allows dashboardy thing)
sudo apt install -y mosquitto mosquitto-clients
set to auto run
sudo systemctl enable mosquitto.service
It does not seem to update as often as the ebus data does. Not sure why.
The VRT350 room controller does not work with the automatic config files for ebusd. But it does work with the 370 config file.
So download all the config files into home/pi/config
Update the ebusd config file to add the command --configpath=/home/pi/config/ebusd-configuration/latest/en
Then edit 15.350.csv to replace everything but the top 2 lines with the lines from 15.370.csv
By changing the r at the beginning to r9 you can make ebusd poll for the latest values (ie ask on the ebus for it). Not sure I want to do this, would be better to request via http.
You can request an update using
ebusctl read DisplayedRoomTemp -f
however this does not always seem to update. You should also be able to do it via http:
http://[ipaddr]:8080/data/350/displayedroomtemp?exact=true&maxage=0
But this seems to send a read command once, then it won't send the read again, for quite a long time (not sure how long)
Eventually I have got round this by implementing TCP in the python script, and sending a read command by tcp with -f option. This forces a read and does work.
Graphing
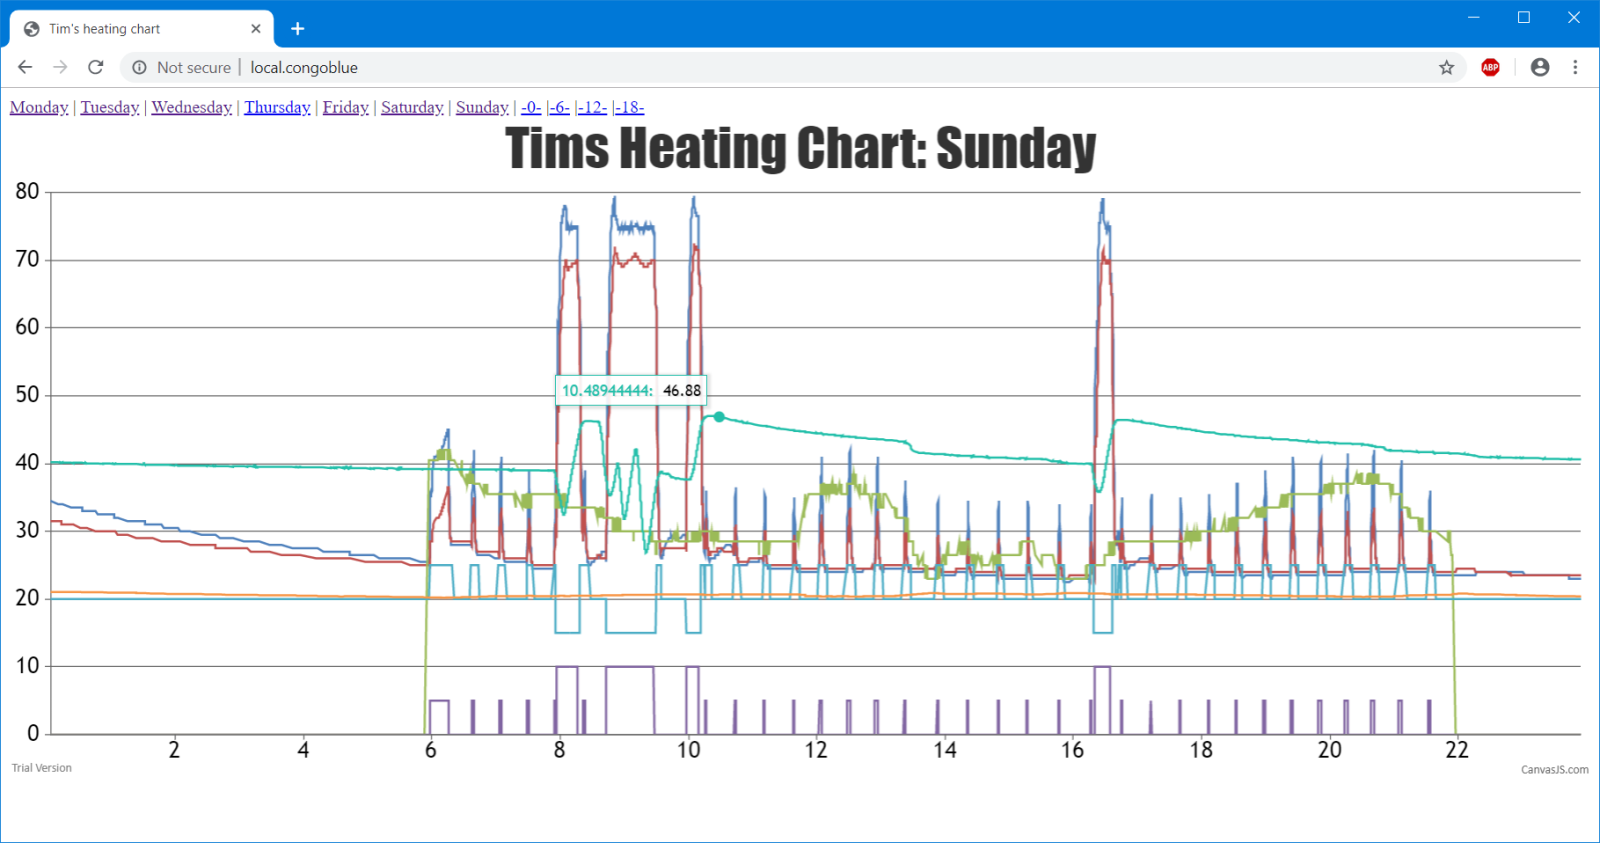
I'd really like to be able to see graphs of how the values change over the day.
To do this I will write a python program which logs all the values to a csv file. Each day will have its own csv. The python will log every 10s but only if the data has changed.
Then we'll have a bit of javascript using canvas.js to render a graph out of the csv file.
There seems to be 2 problems here - one is getting the roomtemp to update as described above. The other is keeping the python running, any slight problem and it will crash out. I have put lots of try... blocks in to try to catch all the potential problems.
To run the python from the command line and keep it running use
setsid python3 disptest.py < /dev/zero >& ebuslog.log &
(edit: this makes an enormous logfile which eventually crashes the pi. better to use the line below:)
setsid python3 disptest.py < /dev/zero >& /dev/null &
(the & at the end makes it run in the background. The redirects are to prevent kbd input and to log the output to a file).
To check if it's still running use
ps -ef
To make it run on boot, put this line in /etc/rc.local
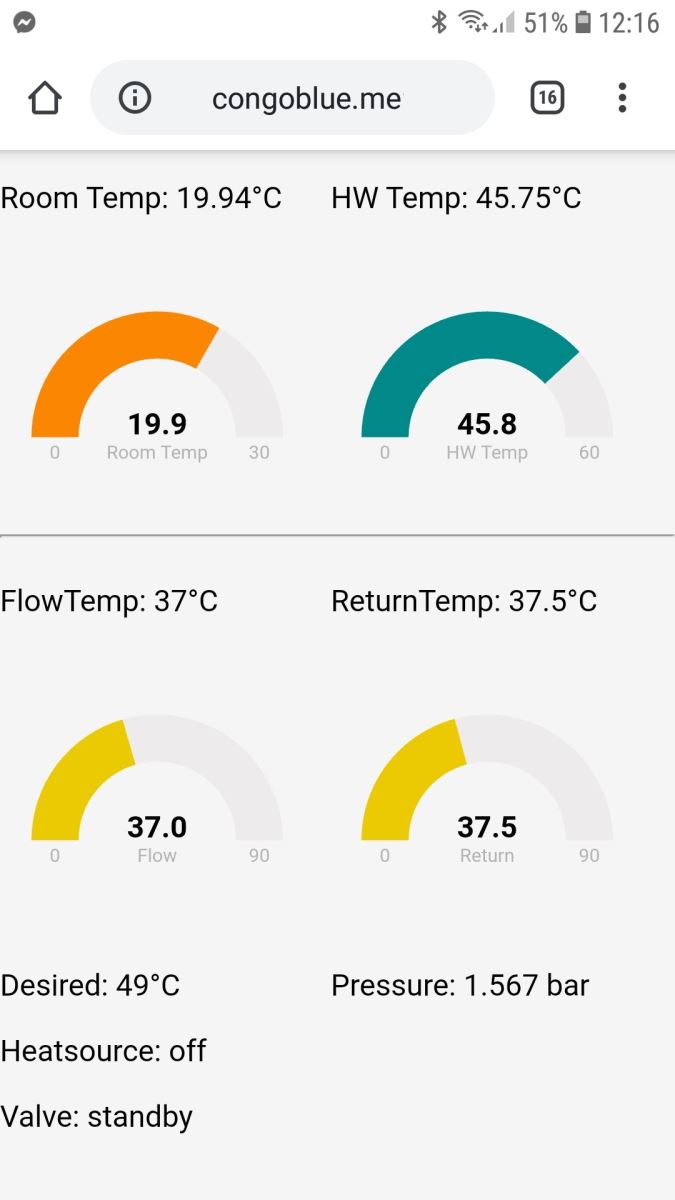
Eventually I have it working, and it is very good
The mqtt feed:

The graphs:

From the top: green=flow target temp from thermostat, blue=boiler flow, red=boiler return, cyan=hotwater temp, lt blue=valve state (up=htg, down=hw, centre=off), orange=actual room temp, purple=boiler run (higher line is hw mode)


